INTRODUCTION
GFA Kaleidos is a tool designed to analyze graph statistics using GFA format input. We characterized the GFA file by modeling it with four different graph representations: directed graph, bidirected graph, and biedged graph. For each model, we computed statistics on vertices, edges, and subgraphs.
QUICK START
Running GFA Kaleidos is straightforward. Read these pictures for a quick start!
[Required] - GFA files
The tool supports GFA format versions v1.0 and v1.1. Certain indicators may not function without path or walk information.
-
Segment lines start with S, a continuous sequence or subsequence.
-
Link lines start with L, an overlap between two segments. Each link is from the end of one segment to the beginning of another segment. The link stores the orientation of each segment and the amount of basepairs overlapping.
-
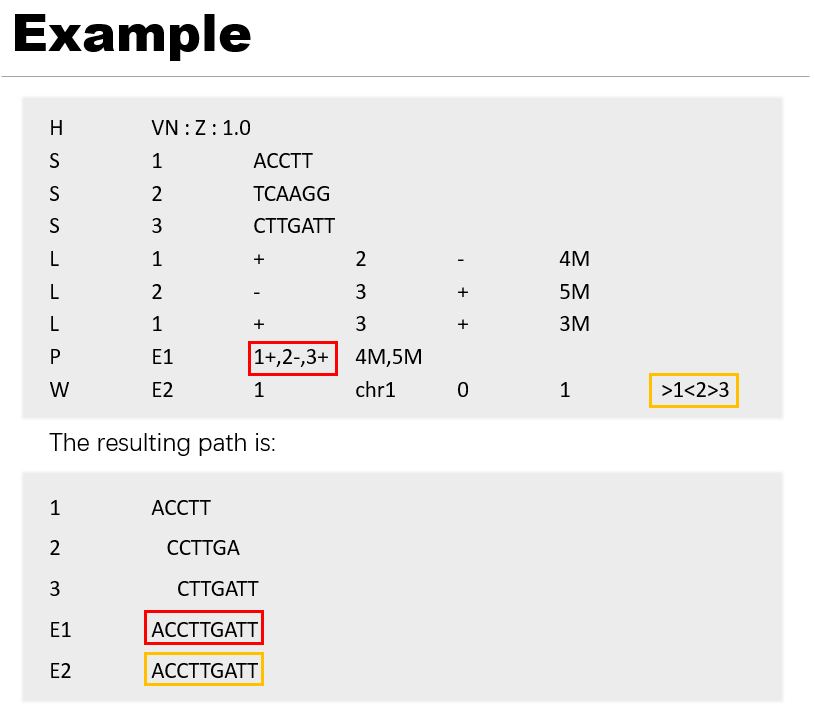
(Optional) Path lines start with P, an ordered list of oriented segments, where each consecutive pair of oriented segments are supported by a link record.
-
(Optional) Walk lines start with W, an ordered list of oriented segments, intended for pangenome use cases. Each consecutive pair of oriented segments must correspond to a 0-overlap link record.
Currently, the software performs well on graphs generated by pggb and Minigraph-Cactus. If you encounter compatibility issues with graphs generated by other software, feel free to reach out to us.
Explore the results
After running GFA Kaleidos, you can explore comprehensive results on the dedicated results page. This page provides detailed insights into the pangenome graph statistics and analysis associated with your input query. Within the results page, you can navigate through various panels, each highlighting essential aspects of the graph. In these panels, you will find:
| Category | Statistic | Description |
|---|---|---|
| GFA file | File Size | Measures the graph's compression efficiency. |
| # of segments | Number of segments in the graph. | |
| # of links | Number of links between segments in the graph. | |
| # of paths | Number of distinct paths within the graph. | |
| # of segment directions | Distribution of segments that are uni- or bidirectional. | |
| Growth | Estimates how the euchromatic autosomal pangenome expands as additional genome assemblies are added. | |
| Vertices | # of vertices | Number of vertices in the graph. |
| Vertex Size | The distribution of the number of bases in the vertex labels within the graph. | |
| Total Length | The total number of bases in the vertex labels, representing the total size of the graph. | |
| N50 | A metric assessing how well the pangenome captures both shared and unique sequences across different genomes. | |
| L50 | The smallest number of sequences whose cumulative length constitutes half of the pangenome size. | |
| U50 | A metric that corrects for inflated or deflated N50 values. | |
| Degree Distribution | High-degree vertices are often mutation hotspots. | |
| Dead Ends | Sequences that terminate without linking to other vertices. | |
| Start Ends | Sequences that initiate without prior connections. | |
| Coverage | The number of distinct paths that pass through a particular vertex. | |
| Edges | # of edges | Number of edges between vertices in the graph. |
| # of loops | Number of tandem repeats without mutation that occur in the graph. | |
| Loop Length | Length of the loops present in the graph. | |
| # of cycles | Cycles represent tandem repeats but also increase the graph's path complexity. | |
| Minimum Weight Cycle | Smaller cycles provide clearer representations of local structures. | |
| Cycle Distribution | Distribution of different cycle sizes in the graph. | |
| Subgraphs | Cuts | Number of cut points used to assess the connectivity of the graph. |
| (Weak) Connected Components | Co-occurring and co-localized variable gene families. | |
| Strongly Connected Components | Regions of high complexity within the graph. | |
| Superbubbles | Bubbles represent key structures, such as heterozygous variants in assembly graphs or polymorphisms in pangenome graphs. | |
| Simple Bubbles | Simple bubble structures within the graph. | |
| Nested Bubbles | Genomic variation creates nested bubble structures, which help organize graph elements spatially. |
Comprehensive statistical metrics presented in a user-friendly web interface.
Structural analysis
GFA Kaleidos helps identify structural variations in the pangenome by analyzing the graph topology. The specific topological structures and their corresponding physical meanings are as follows:
-
Degree Distribution: High-degree vertices are often mutation hotspots.
-
Strongly Connected Components: Regions of high complexity within the graph.
Cycle Distribution: Cycles represent tandem repeats but also increase the graph’s path complexity.
-
Nested Bubbles: Genomic variation creates nested bubble structures, which help organize graph elements spatially.
Compute Multiple GFA Files
-
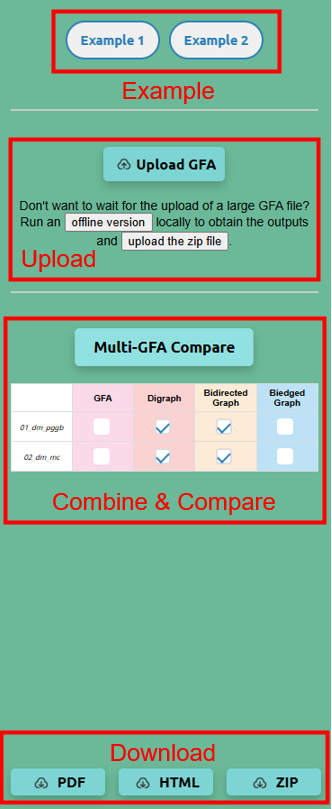
Example: The top right corner of the tool interface provides two examples, which are GFA files constructed from 10 haplotypes of Drosophila chromosome 4 assembled by pggb and minigraph, respectively.
-
Upload and Display: You can upload multiple GFA files to the platform. Each file will open in its dedicated tab within the web interface, enabling easy navigation and comparison of graph models.
-
Combine and Visualize: Users can select multiple GFA files and their associated graph models to combine and visualize on a single page. This feature allows for side-by-side comparisons and better contextual analysis of structural variations.
- Graph models include digraph, bidirected graph and biedged graph. You can choose to display one or more models simultaneously, depending on your analysis needs.
-
Interactive Features: Each graph visualization is fully interactive, allowing users to zoom, pan, and explore the connections and structural variations within the graph. Hovering over nodes or edges displays additional details such as sequence lengths and adjacency relationships.
-
Download Options: After comparing and analyzing the files, you can download:
- A summary table of the combined analysis in PDF HTML or ZIP format.
WORKFLOW & IMPLEMENTATION
Here is a workflow scheme for GFA Kaleidos. The input/output of the analysis are shown in grey.
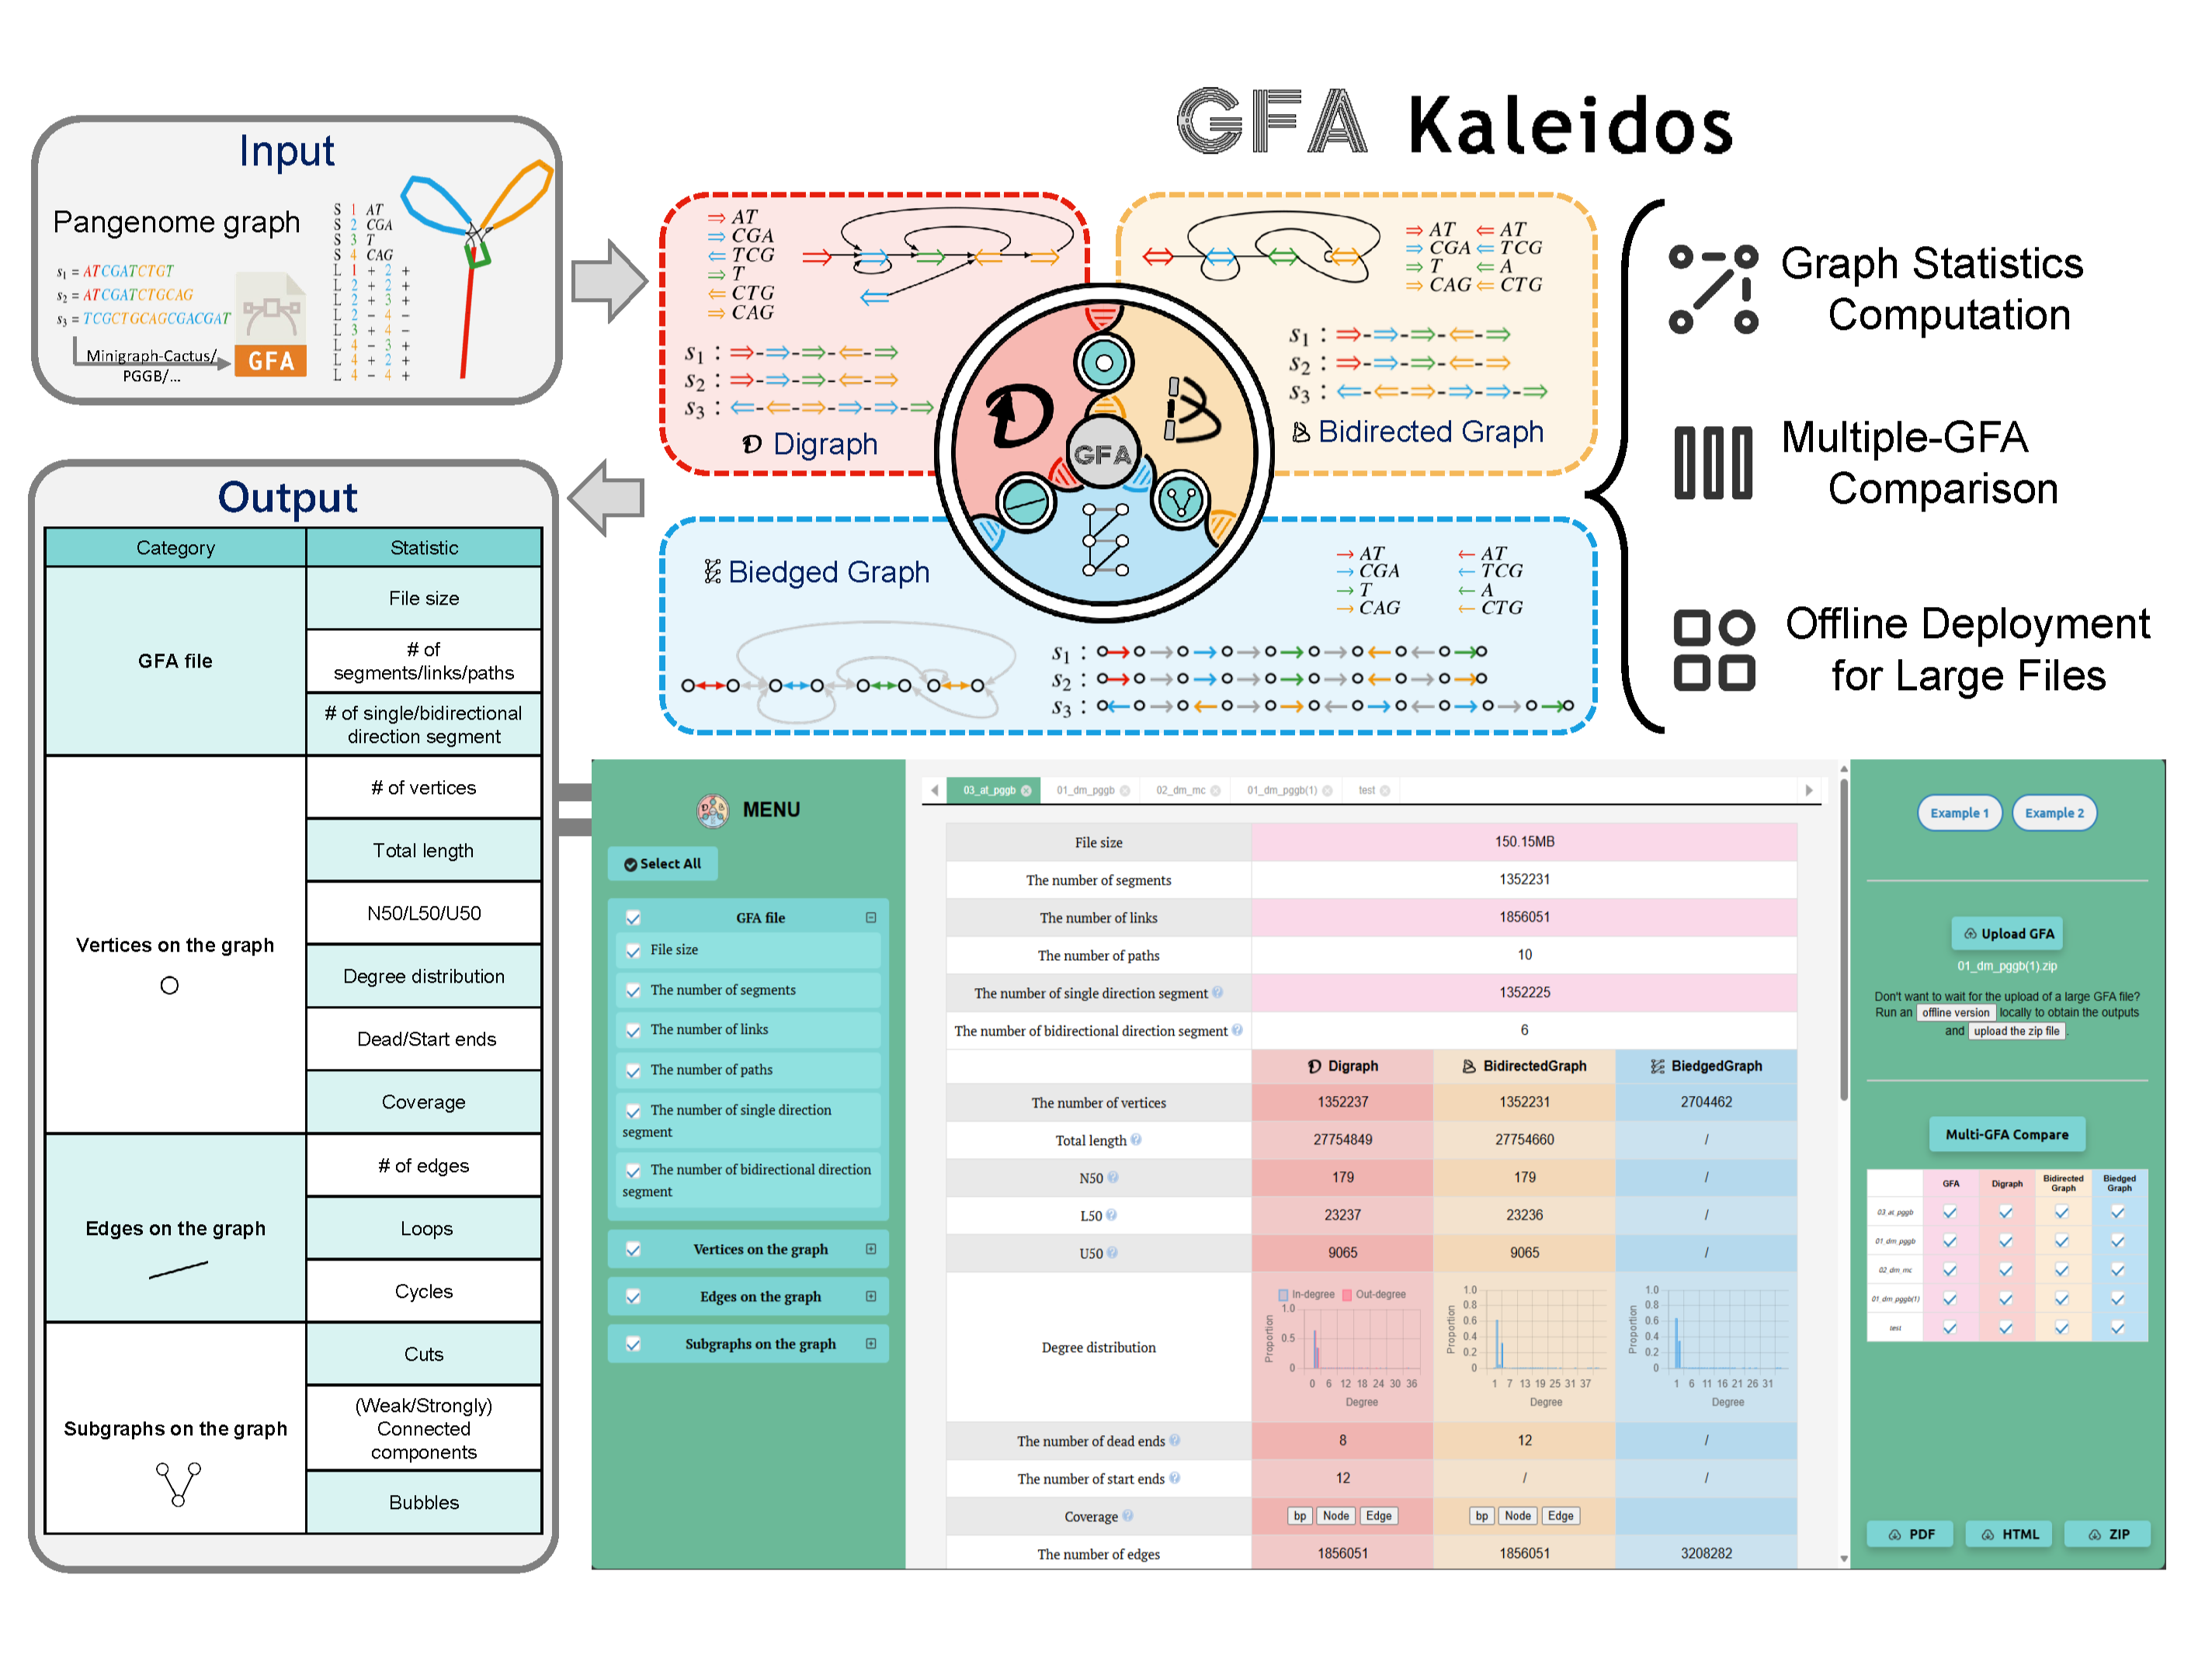
Input: GFA Kaleidos integrates pangenome graphs in GFA format.
Graph Analysis Protocol: The workflow is implemented in C++ and designed to analyze complex graph structures. By cross-referencing GFA files with statistical metrics and graph models, the protocol extracts insights such as vertex connectivity, structural variations, and adjacency relationships. For each graph, the workflow evaluates:
- The alignment of sequences and their associated structural variations.
- Forward and reverse paths within the graph, identifying key genomic elements.
- Critical regions such as superbubbles and cycles, highlighting polymorphisms and tandem repeats.